The JVM Was Calling System.gc() Behind My Back
Feedhouse, a small BoxLang RSS reader, was running up to 70 full GCs an hour with its heap a quarter full. The likely cause: when direct (off-heap) buffer memory reaches -XX:MaxDirectMemorySize, the JDK calls System.gc() itself, and I had capped it at 64 MB. Raising the cap to 128 MB cut full GCs to 2-5 an hour, past the point where the spike used to begin. How I tracked it down with hourly JVM metrics and an admin GraphQL API, driven by Claude Code.
 12 min read
21 views

Feedhouse, my RSS reader, started running up to 70 full garbage collections an hour, while its heap sat a quarter full and its CPU barely moved. Each one paused the whole server for about 400 ms.
Feedhouse is a small app: a BoxLang server on one droplet, about 50 users, and roughly 1,000 feed fetches an hour. Nothing about that load should force the JVM into a full collection every minute. This post covers how I found the cause, a JDK behaviour I hadn't run into before, and what changed once it was fixed.
The short version: the JVM calls System.gc() on its own when direct (off-heap) buffer memory reaches -XX:MaxDirectMemorySize, and I had set that cap to 64 MB.
The setup
Feedhouse runs on a single 1 vCPU, 2 GB App Platform container. The server isn't a traditional servlet deployment: there's no WAR, no servlet container and no CommandBox. It's a plain BoxLang script, started from the command line with boxlang server.bxs, that uses the BoxLang Express module (boxlang-express) to run an embedded Undertow web server in the same JVM. The JVM is therefore the app's own process, and every flag was picked for that one small box:
-Xmx1280m -Xms512m -Xmn256m -XX:+UseSerialGC -XX:ActiveProcessorCount=1
-XX:MaxDirectMemorySize=64m -XX:+ExitOnOutOfMemoryError
| Flag | Why |
|---|---|
-Xmx1280m | Caps the heap and leaves about 700 MB for metaspace, threads and native memory. |
-Xms512m | Starting at 256 MB cost four full GCs before the heap had grown to its working size. |
-Xmn256m | Polling makes a lot of short-lived garbage. With a 160 MB young generation it was promoted early and filled the old generation: 15 to 19 full GCs an hour while only 60 to 85 MB was live. |
-XX:+UseSerialGC | One core, so a parallel or concurrent collector buys nothing. |
-XX:ActiveProcessorCount=1 | The JVM otherwise sees the host's cores, not the container's. |
-XX:MaxDirectMemorySize=64m | Caps Undertow's off-heap buffers, so a spike fails loudly instead of the container being killed for running out of memory. |
-XX:+ExitOnOutOfMemoryError | Out of memory, the process exits and the platform restarts it. |
The -Xmn row matters later: I had already fixed one full GC problem on this server, and that fix brought full GCs down to 2 to 6 an hour. So when the count climbed again, early promotion was the first thing I could rule out.
The monitoring that made it visible
I only noticed because the server keeps its own history. Once an hour, a ServerHistory service reads the JVM through java.lang.management and writes one row to a server_metrics table, kept for 90 days:
- old-generation memory right after the last full GC (the leak detector)
- full GCs and total GC time since the previous row
- CPU load, HTTP requests and HTTP errors for the hour
- feeds fetched, fetches that failed, and how many feeds are failing
The per-hour figures are differences from the previous row, so the first row after a restart has none. That row is also how a restart shows up in the history.
The same service sends every admin a push notification when a row looks wrong: 5 or more server errors in an hour, 20% of feed checks failing, polling 15 minutes behind, the old generation 75% full after GC, or 15 more failing feeds than a day earlier. Each kind of alert goes out at most once every 6 hours.
All of it is readable through an admin GraphQL API. serverStatus reads the JVM live: heap pools, collectors, threads, Undertow's counters and the database pool. serverHistory(hours:) returns the hourly rows. A query like this one is how this investigation started:
{ serverHistory(hours: 24) { recordedAt oldGenAfterGc cpuLoadHour fullGcsHour httpRequestsHour fetchedHour } }
None of this sounded any alarm: memory was never close to the 75% threshold. The full GC count just looked wrong next to everything else.
Ruling out the usual suspects
The old generation never filled, so neither a leak nor early promotion fits. With SerialGC, a full collection (MarkSweepCompact) normally runs because the old generation has run out of room. Each usual cause leaves a sign in the numbers:
| Usual cause | What it would look like | What the numbers showed |
|---|---|---|
| A memory leak | Old generation after GC climbing hour after hour | Flat, between 56 and 120 MB for two days |
Early promotion (the -Xmn problem again) | Many young GCs feeding the old generation until it fills | 2 young GCs and 2 full GCs in the same minute |
| A full old generation | Old generation near its committed size before each full GC | 62 to 63 MB of 256 MB committed, before and after |
| Load | CPU and feed fetches up | CPU about 0.13, fetches steady at about 1,000 an hour |
The third row settled it. I read serverStatus twice, a minute apart. Both readings showed the old generation at 62 to 63 MB of its 256 MB, and two full collections had run between them. A collector that triggers on a full old generation doesn't run at 25%. Something was asking for these collections explicitly.
The one figure that did move with the full GC count was HTTP traffic. Fetching ran at about 1,000 an hour no matter what, but full GCs rose and fell with requests to the web server:
| Hour (UTC) | HTTP requests | Full GCs |
|---|---|---|
| Oct 29, 13:00 | 1,164 | 70 |
| Oct 29, 12:00 | 911 | 47 |
| Oct 28, 17:00 | 2,106 | 26 |
| Oct 27, 19:45 | 4,763 | 18 |
| quiet hours | about 400 | 6 to 13 |
The match isn't one to one: Oct 29 had more full GCs per request than Oct 27. The count also built up slowly. After a restart at 00:01 on Oct 28, full GCs stayed at 3 to 10 an hour until about 17:00, and only then climbed. Whatever it was, it accumulated.
The likely cause: the JDK's own System.gc()
Nothing in Feedhouse calls System.gc(), so I looked for the JDK calling it. It does, in one well-known place: allocating a direct ByteBuffer.
Direct buffers live outside the heap, and their total is capped by -XX:MaxDirectMemorySize. The native memory behind a buffer is only freed once the small ByteBuffer object on the heap is collected. When a new allocation would go over the cap, the JDK (java.nio.Bits.reserveMemory) calls System.gc() to collect unreachable buffers, then retries. Under SerialGC that's a full, stop-the-world collection, however empty the old generation is.
Undertow, the web server BoxLang Express embeds, is a heavy user of direct buffers. It reads and writes every HTTP connection through them. Feedhouse also holds connections open: the app keeps an /api/events stream per open tab for presence and notifications.
That fits all three clues:
- It follows HTTP traffic, not fetching. Feed fetching runs at a steady 1,000 an hour, so it can't explain an hourly swing. Web requests, which go through Undertow's direct buffers, can.
- It builds up over hours. A buffer held by a long-lived connection outlives a couple of young collections and is promoted to the old generation. Its native memory then stays reserved until the next full GC, so reserved memory creeps toward the cap.
- It runs with the old generation mostly empty. A
System.gc()doesn't care how full the heap is.
I had set the 64 MB cap myself, so a spike in Undertow's buffers would fail loudly instead of the container being killed. It did fail: just quietly, as a full collection every minute or so.
The fix, and a way to check it
I shipped two changes in one deploy: a measurement and a fix. Up to then this was a theory. The admin API had no way to show direct buffer memory, so I couldn't see the cap being hit.
The measurement. serverStatus now reports the direct buffer pool through BufferPoolMXBean, next to its cap. The cap comes from HotSpotDiagnosticMXBean, falling back to the heap's maximum when MaxDirectMemorySize isn't set:
{ serverStatus { memory { direct { buffers used capacity max } } } }
Each hourly row now records directUsed too, so the next spike can be read back against the full GC count.
The fix. MaxDirectMemorySize went from 64 MB to 128 MB. The memory budget still fits the 2 GB container: a 1,280 MB heap, about 150 MB of non-heap, and 128 MB of buffers.
I didn't use -XX:+DisableExplicitGC, which is the usual advice for unwanted System.gc() calls. Here those calls are the only thing that frees promoted buffers. Disable them, and the server hits the cap and throws OutOfMemoryError: Direct buffer memory instead.
Shipping both at once means the new reading can't show the old cap being hit. What it can show is whether direct memory climbs past 64 MB while full GCs stay low.
Results
Raising the cap worked. Through 23 hours of uptime, past the point where the last spike began, full GCs stayed at 2 to 5 an hour, against up to 70 before.
The deploy went live at 14:04 UTC on Oct 29. In its first 75 minutes there were 8 full GCs, 2 of them at startup, at about 1,180 HTTP requests. The two hours before the deploy had 70 and 67 at similar traffic. Direct memory stood at 10.5 MB across 108 buffers.
That proves little on its own: after the previous restart, full GCs also stayed low for about 17 hours. The real test is the hours after that point.
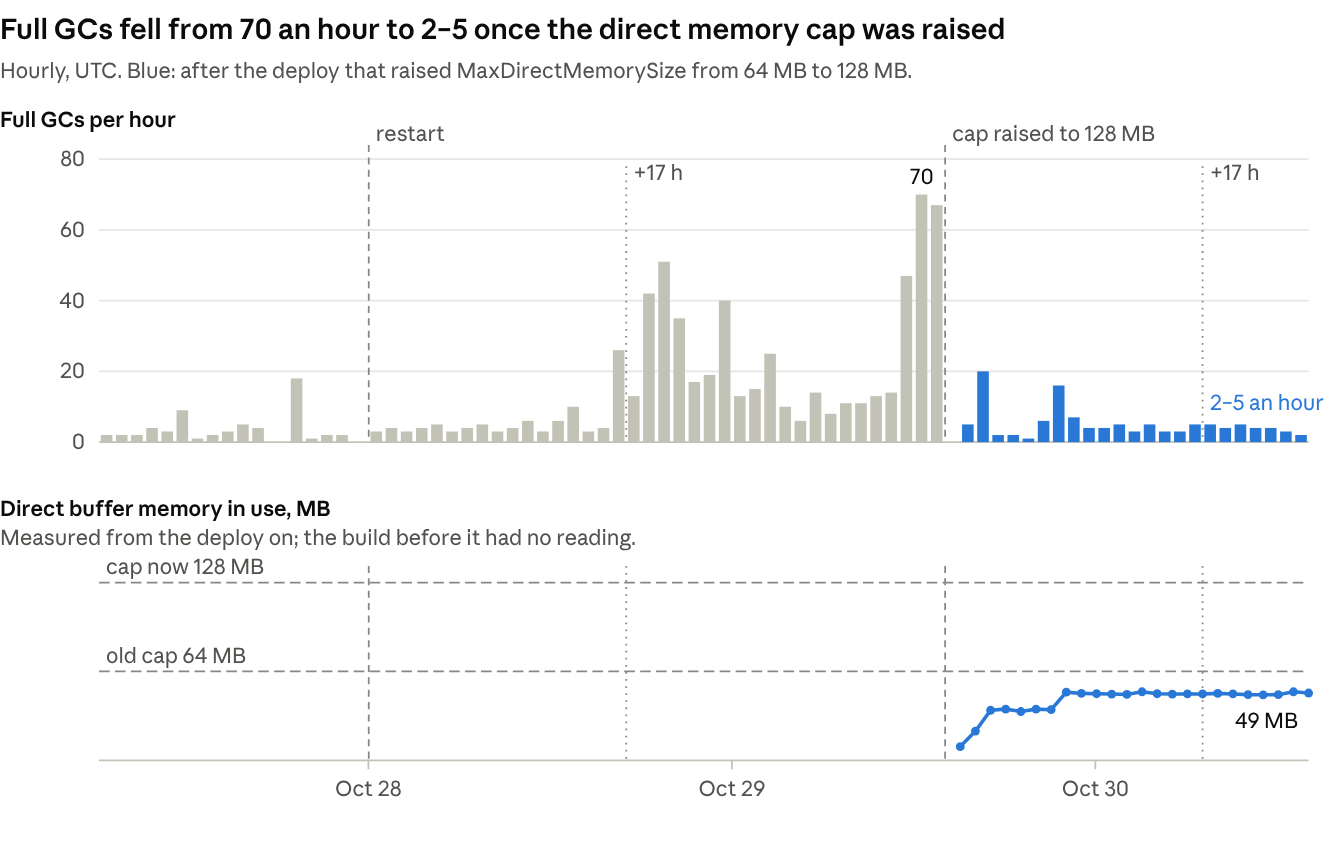
Last time the climb began about 17 hours after a restart. This time that mark passed with full GCs at 5 an hour, and direct memory flat between 47 and 49 MB.
What would settle it:
- The cap was the cause if full GCs stay in single digits past 17 hours of uptime at similar traffic, especially if direct memory climbs past 64 MB.
- It wasn't if full GCs climb back toward 26 to 70 an hour while direct memory stays well under 128 MB.
The first one happened, with one gap. Traffic doesn't explain the drop: most hours after the deploy had 700 to 1,900 requests, against 911 and 1,164 in the two worst hours before it. Only two hours went above 10 full GCs: 20 in the third hour after startup, and 16 in the busiest hour of the night, at 3,348 requests, nearly three times the traffic of the 70 hour.
The gap is that direct memory never passed 64 MB. It reached 36 MB within three hours, stepped up to 49 MB in that busy hour, and has stayed between 47 and 49 MB since. That leaves about 15 MB of headroom under the old cap, and an hourly reading can't see the bursts in between, when Undertow takes buffers for many connections at once. The old cap being crossed between readings is plausible, but this data doesn't show it.
The next deploy narrows that gap. The server now counts full GCs by cause, from the JVM's GC notifications. If the spike comes back, it will say System.gc() if the buffer cap is behind it again, and something else if it isn't.
Running a site through an admin API and an AI assistant
I didn't open a dashboard once during this. I run Feedhouse by asking Claude Code, which has a skill that queries the admin GraphQL API with a bearer token. The skill carries the schema, a few example queries, and a list of mutations that need my say-so before they run.
The investigation began with a routine "server and user status". That status flagged the jump in full GCs, and "look into the full GC spike" took it from there. It read the hourly history, sampled serverStatus a minute apart, read the Dockerfile and the monitoring code, and proposed the measurement and the fix. I reviewed the change, it ran the tests, and it committed and deployed when I said yes. The results above came the same way, from "check server stats" the next morning.
The same API handles everyday admin work:
- Feed health. One question found that 7 of 10 YouTube feeds were failing with 404s at once. Fetching one by hand returned a 200, so it was YouTube refusing temporarily, not dead feeds. Refreshing them cleared all seven.
- Failing feeds. A breakdown of 525 failing feeds by error and host showed almost all of them come from old OPML imports: FeedBurner, Posterous and long-gone domains. Only 3 have more than one subscriber.
- Users. Who's active, who signed up and never added a feed, who imported a huge list and stopped coming back.
Three things make this work. The API exposes the raw readings, not just summaries. The server keeps its own history, so questions about "since yesterday" have answers. And anything that changes production asks first.
Takeaways
- Full GCs with an empty old generation mean something is asking for them. Check how full the old generation is when they run before tuning the heap.
MaxDirectMemorySizeis a GC setting too. Set it too low and the JDK collects to make room, which looks like a heap problem.- Don't reach for
-XX:+DisableExplicitGCby reflex. If direct buffers are behind the calls, disabling them trades pauses forOutOfMemoryError. - Keep your server's history in your own database. An hourly row of a dozen JVM numbers was enough to see this, and the per-hour differences cost nothing.
- Ship the measurement with the fix. Without it, "it got better" can't be told apart from "it restarted".



No comments yet — be the first.